
GET THE LEAD OUT NOW!
Research and Data Analysis
We began our water quality research in our home state of New Jersey. We discovered that 11 cities and 2 counties had worse water quality than Flint, Michigan. We decided to investigate the water quality in NJ schools, where children spend most of their day. We conducted an exhaustive search of school districts' websites to determine if there is a connection between socio-economic factors and ethnic diversity.
District Factor Groups
District Factor Groups (DFGs) represent an approximate measure of a community's relative socioeconomic status (SES).
DFGs are calculated using the following variables :
1) Percent of adults with no high school diploma
2) Percent of adults with some college education
3) Occupational status
4) Unemployment rate
5) Percent of individuals in poverty
6) Median family income.
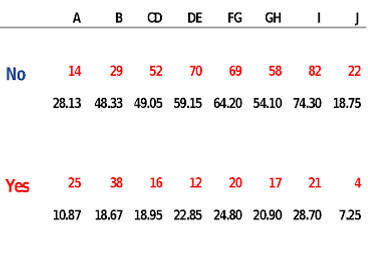
Graphical Results

The Graphical Results of the data indicates that there is a relationship between a school district’s District Factor Group and Ethnic Diversity and the presence of lead in a School District’s drinking water. We traveled to Stockton University and worked with Dr.Stephen Kubricki to conduct further statistical analysis of the data.
.png)
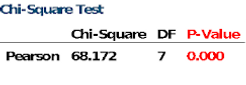
CONCLUSION: Based on the Chi-Square test (p =.000) it can be shown with almost certainty that a school district’s relative socioeconomic status and lead presence are significantly related. Specifically, school districts located in lower socioeconomic areas have a statistically significant higher number of positive lead readings.
Q1 Q2 Q3 Q4
No 107 100 100 72
94.93 94.93 94.93 94.93
Yes 25 33 33 61
37.79 38.07 38.07 38.07

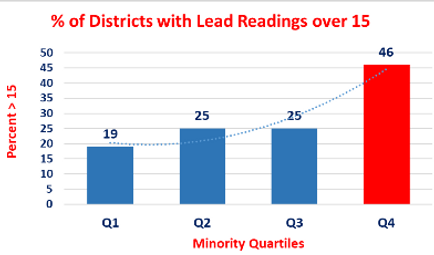
CONCLUSION: Based on the Chi-Square (p = .000)
test it can be shown with almost certainty that the
percent of minority students in a district
and lead presence are significantly related.
Specifically, school districts in the upper quartile –
highest minority percentage, have significantly
higher numbers of positive lead test readings.